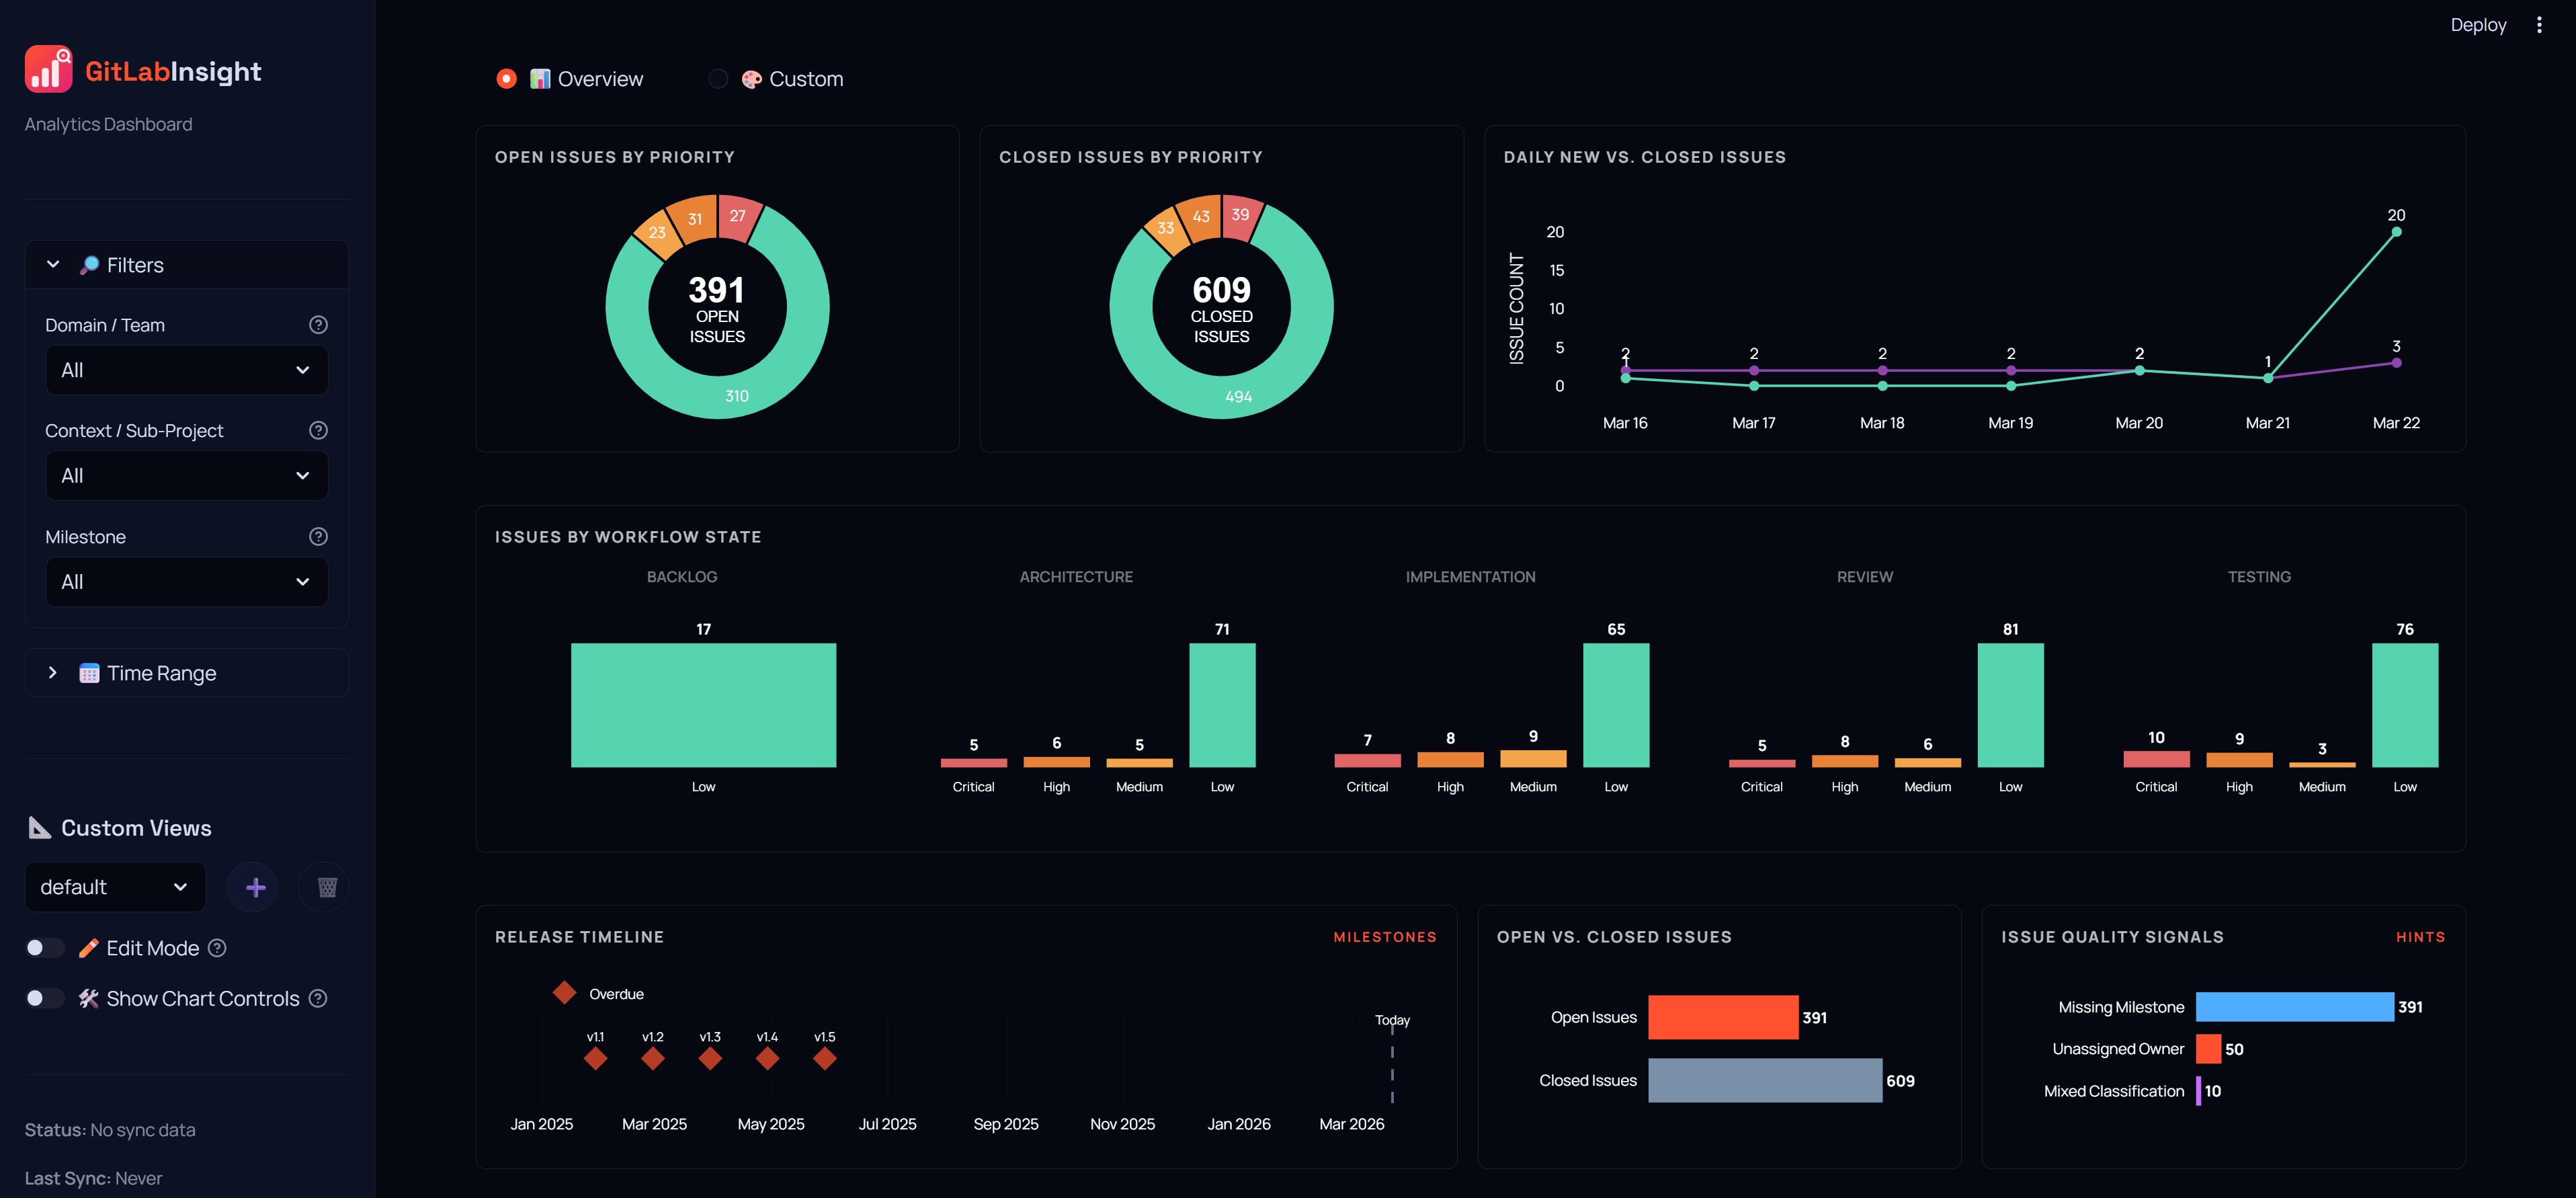
GitLab Pulse App
Dashboards for your GitLab Projects.
Track issue velocity, workflow states, and milestone health across your repositories.
bleviet.github.io/gitlab-pulse/
Track issue velocity, workflow states, and milestone health across your repositories.
GitLab Pulse parses your issues and milestones to generate the following views.
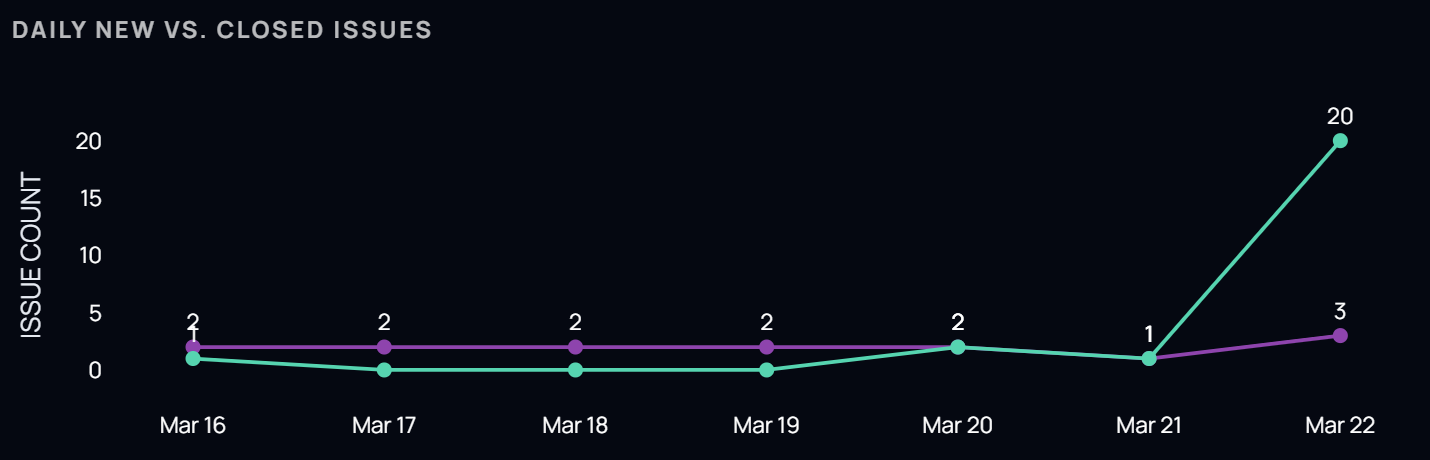
A stacked area chart comparing daily opened vs. closed issues over a 7-day window.
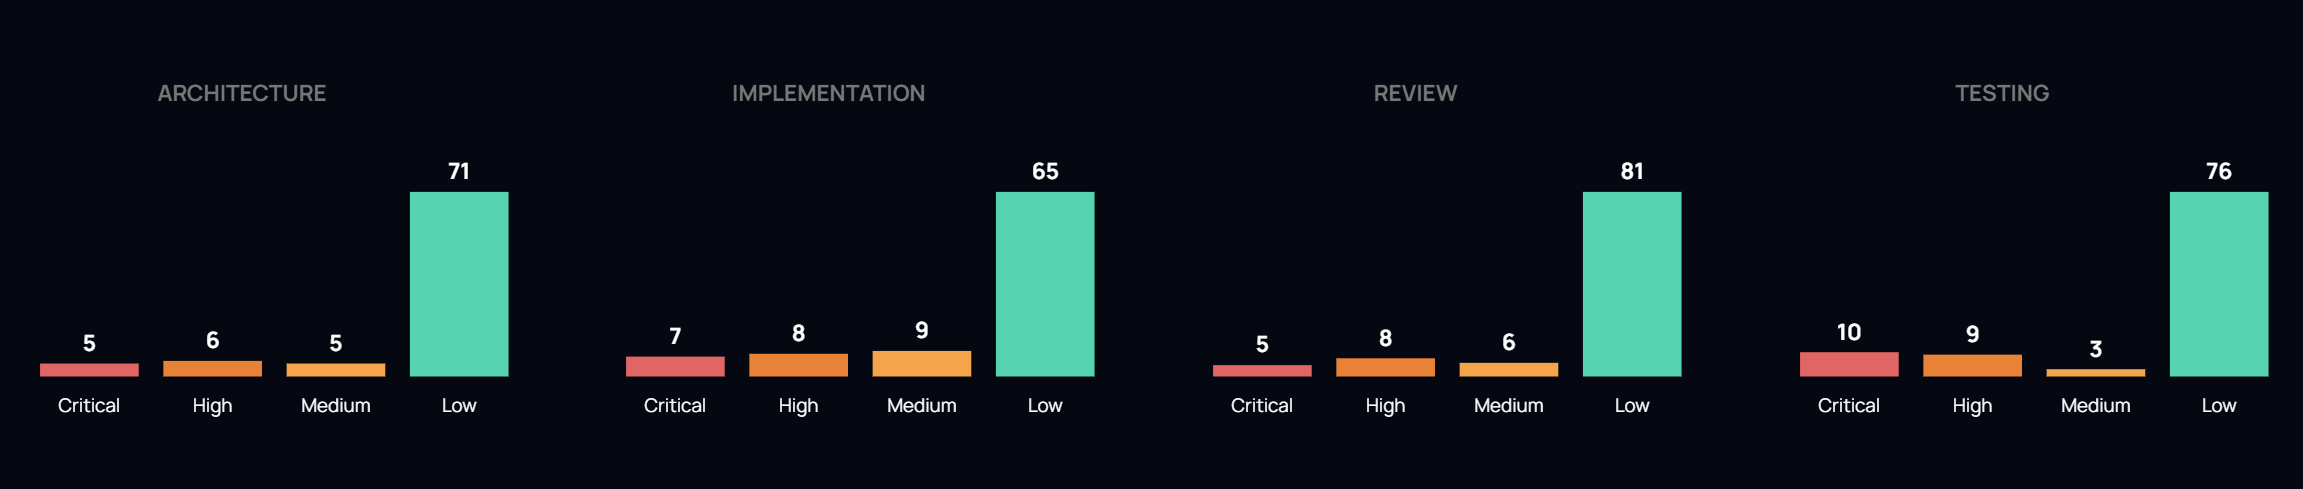
Issues grouped by specific labels (e.g., architecture, implementation, review) to identify where work is currently sitting in your pipeline.
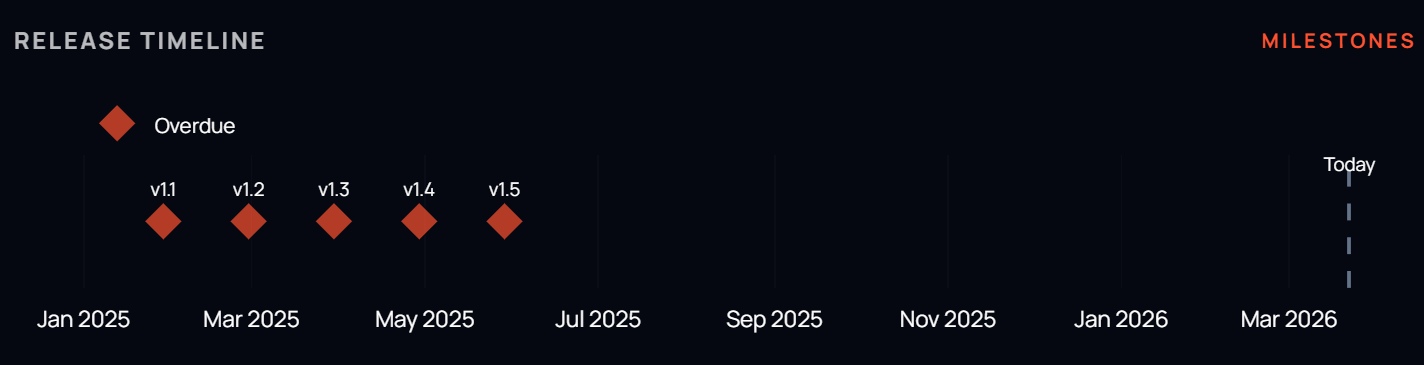
A horizontal Gantt-style view of milestones showing their health (overdue, on track, completed) and deadlines.
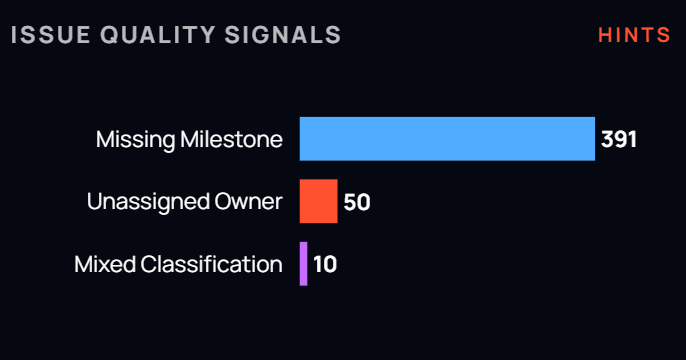
Lists issues that are missing critical labels—such as milestones, or assignees—to help keep your backlog organized.
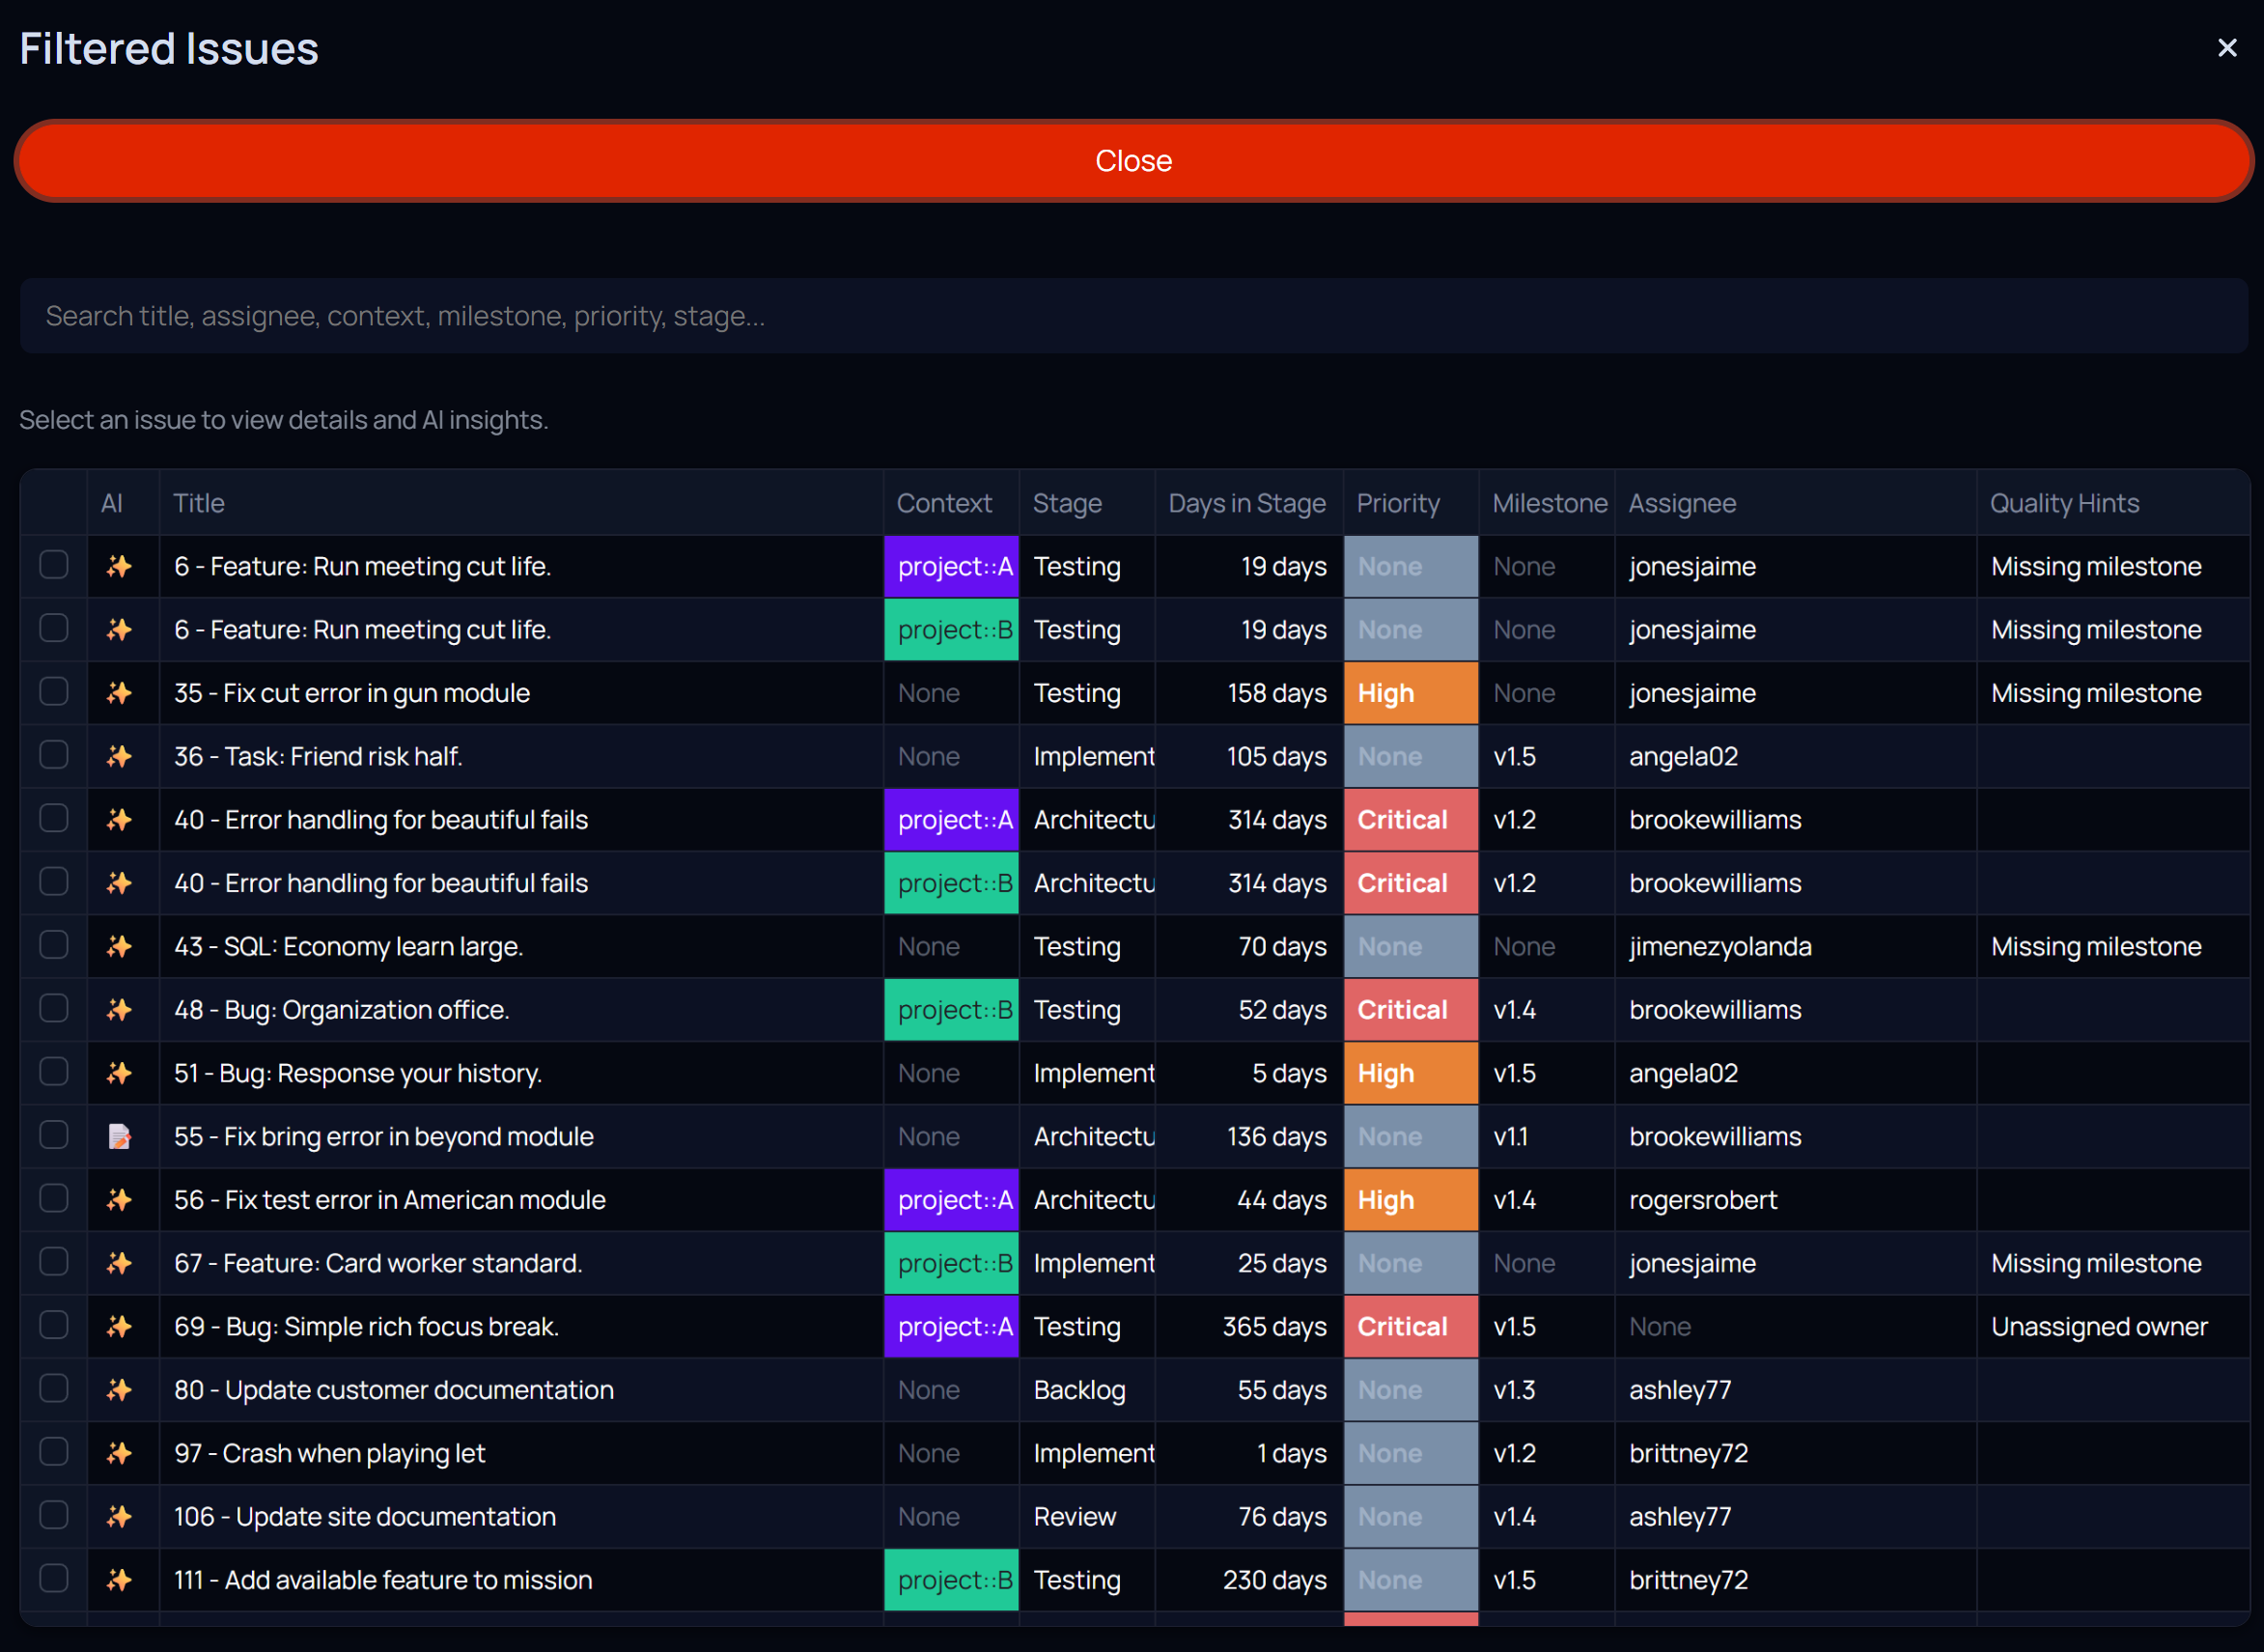
Select any segment in the bar charts or donut charts to instantly filter the issue table. Fuzzy search through all columns to quickly find issues by title, assignee, label, or any other metadata.
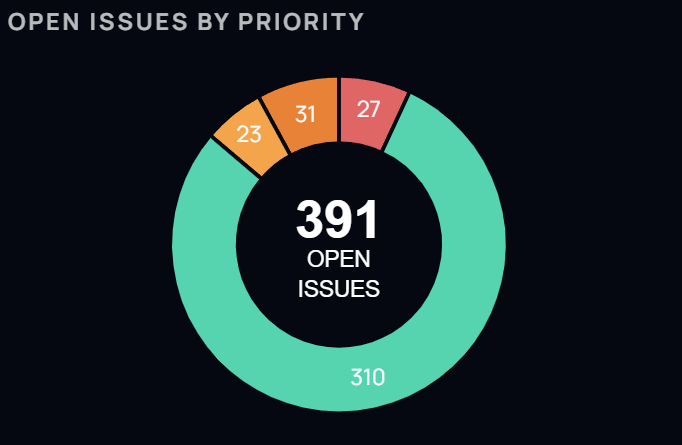
Real-time distribution of issues by priority level. Identify bottlenecks in high-priority tasks and ensure your team is focused on what matters most.
GitLab Pulse fetches data from the GitLab API to populate pre-configured charts.
Visual representation of issue volume over time using area and bar charts.
Aggregated issue counts based on workflow labels and priority levels.
Aggregated metrics for specific milestones, including burn-down status and unassigned items.
Powered by Ollama to provide local AI insights. Summarize project health, identify risks, and suggest backlog improvements without your data leaving your machine.
Click on any chart segment to instantly filter your data. Exploring your project is intuitive and fast.
Full support for Dark and Light modes. A cohesive experience tailored to your workspace environment.